

A bit of context
The initial idea for the app emerged from a WhatsApp group of truck drivers in African countries. They created the group to inform each other about road constraints as the roads are mostly used by them and there was no source to inform them about the accessibility of the roads.
The logistics cluster approached us and requested a redesign of their platform. Their existing platform had numerous issues and did not reflect their vision. They wanted a complete overhaul that would improve usability and give their product a fresh, new look.
Although the collaboration was brief and the deadline was tight, the designs we delivered made them extremely satisfied.
Viewer side
The platform had two different sides. One was for viewers who had access to the data and could use the map's features. The other side was for editors who were responsible for ensuring the validity and reliability of the data that was added to the map.
The viewers were mostly truck drivers or other WFP members who noticed any constraints on the road and wanted to report them. They also used the platform to get updates on road conditions and make sure there were no blockers for their operations.
Modules
From the stakeholders' point of view, modules were considered the core features that would bring the most value to users. Essentially, modules were a group of pre-selected layers designed for specific use cases. For instance, the "Physical Access Constraint" module comprises multiple layers, such as Warehouses, Roads, Ports, and Airports.
Users have the flexibility to customize the modules by adding or removing layers according to their preferences.
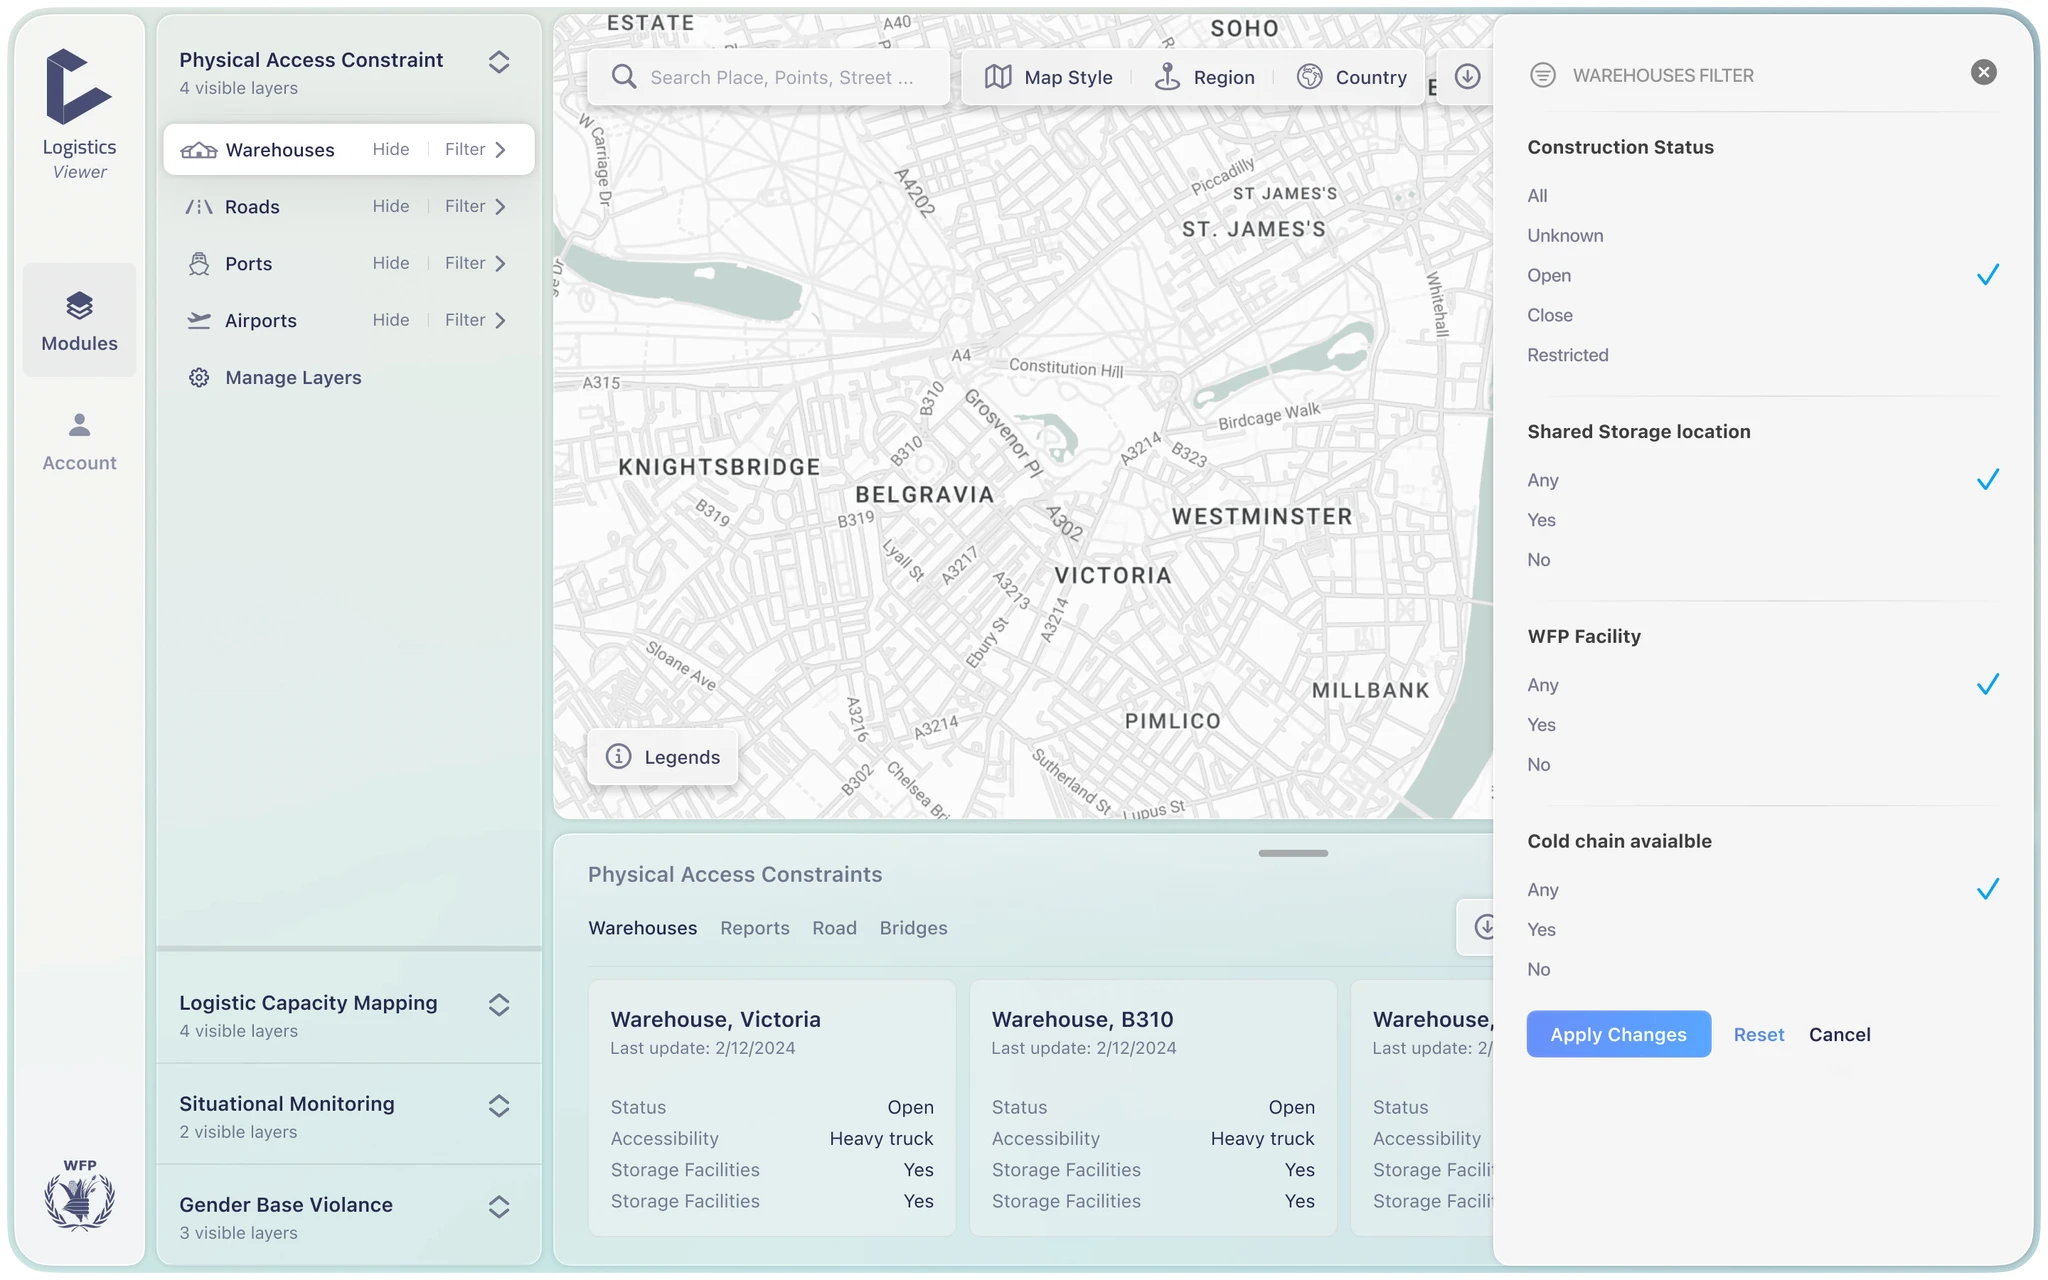
Each layer on the map corresponds to a particular point or area. To display the details of these points of interest (POIs), I created a section below the map that functions in a similar manner. When users choose a POI on the map, they can view the relevant details in this section, and vice versa.

Filtering layers
To make the data as useful as possible, we have included filtering options for each layer. For example, if someone is looking for a warehouse with specific attributes, they can use the filter option to reduce the number of points of interest (POIs) and see only those that fit their requirements.
Analytics
One of the requirements from the client was to find a way to display all the map data in a visual format. They believed that having a visual representation of the data could be very useful in certain scenarios, such as making strategic decisions or presenting data to others.
Furthermore, it was essential to ensure that the entire experience was highly interactive. The client wanted to enable users to modify the data from layers and modules and see the changes visually in real-time.
To achieve this, I utilized the right-hand side of the screen to display the analytics. With this solution, users could access the layers and modules on the left, the POIs details at the bottom, and the analytics on the right-hand side of the map.

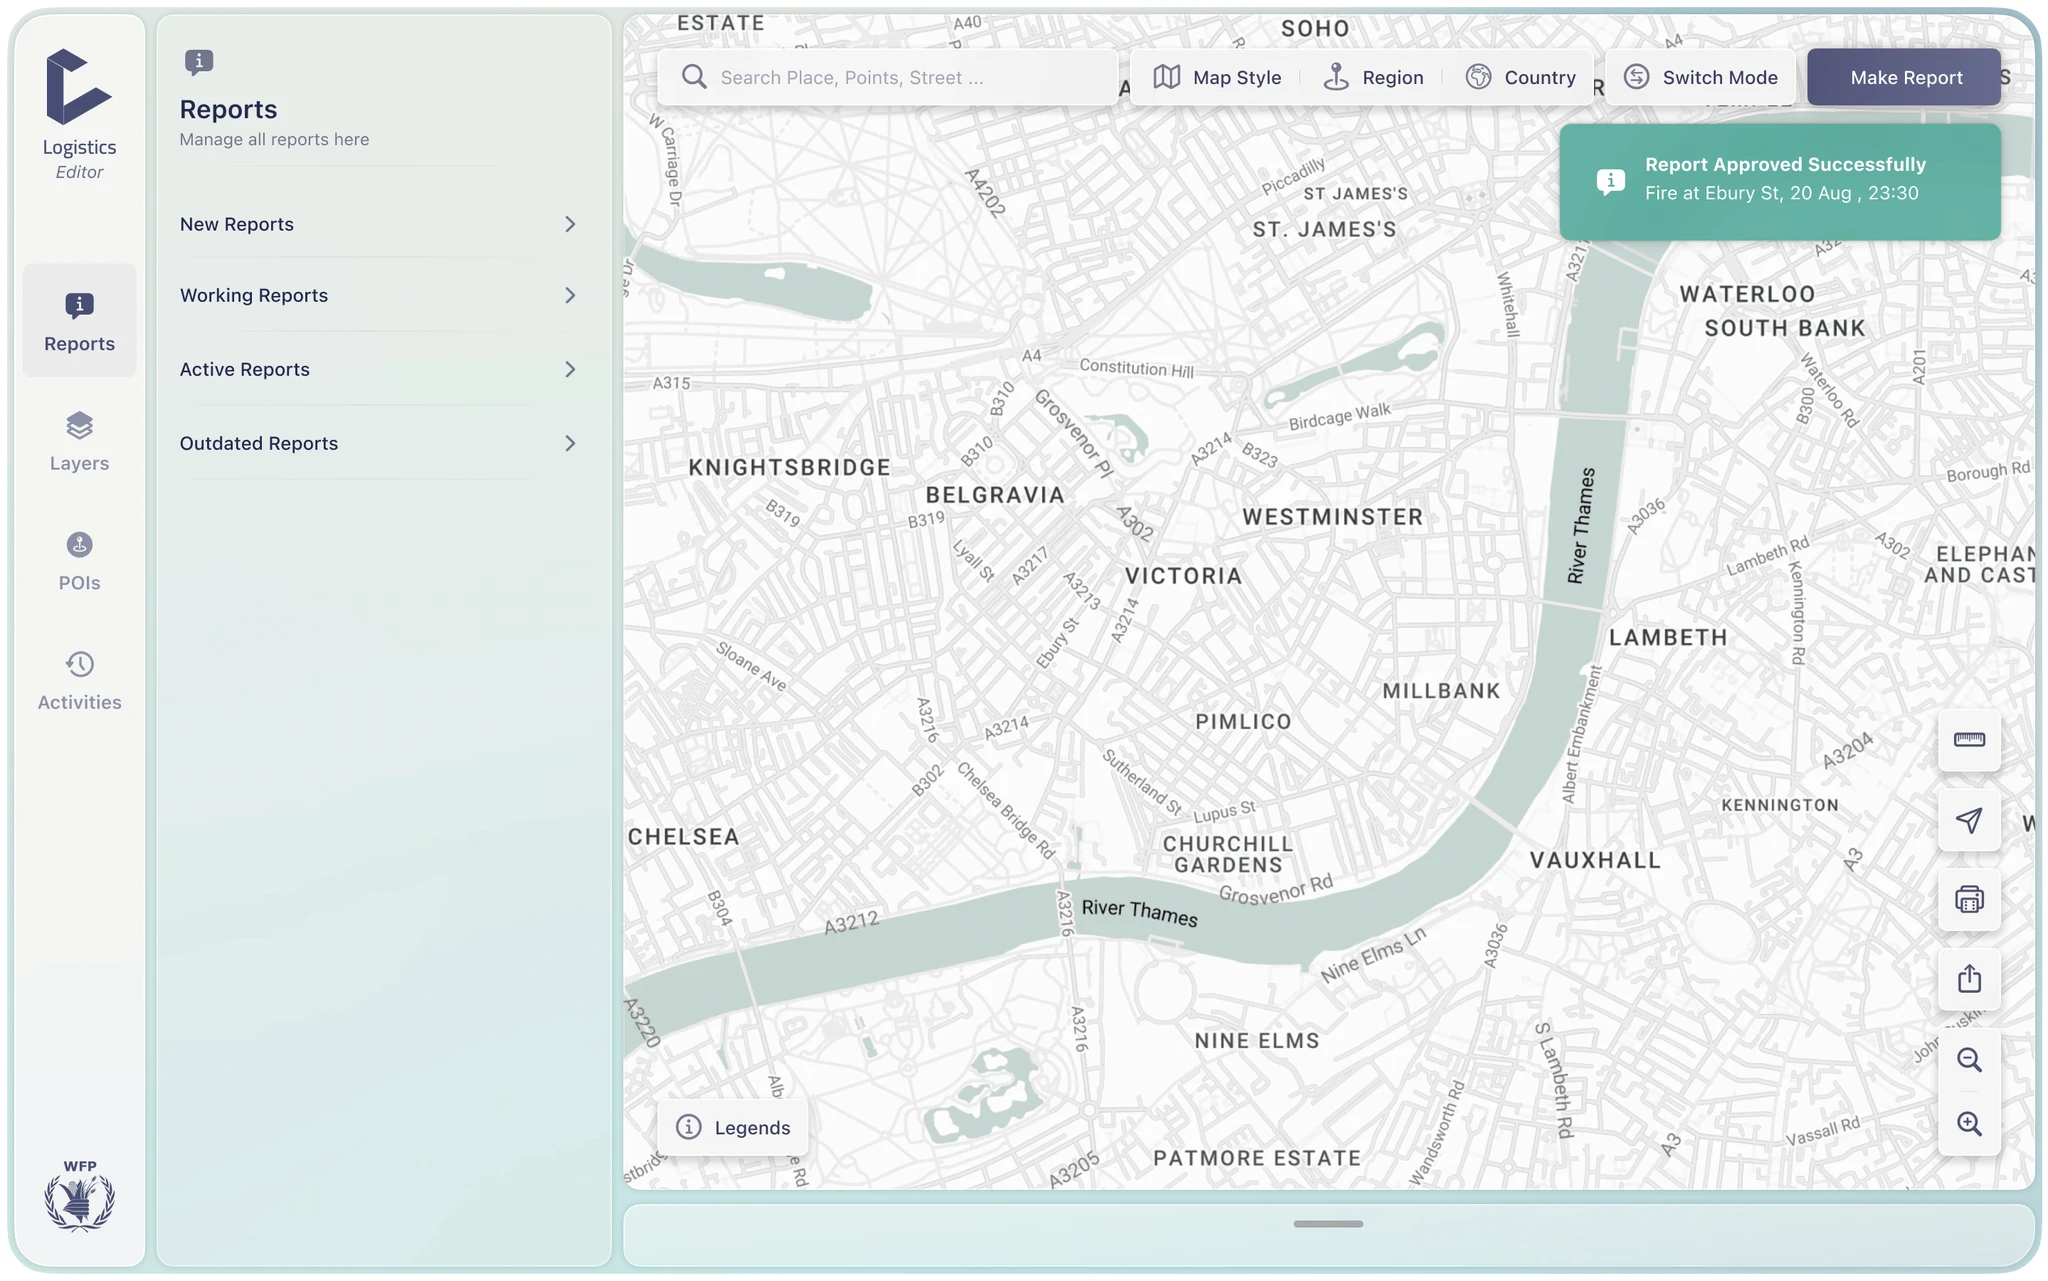
Editor's View
Across the platform, map data managers were in charge of overseeing the information. Their role was to authenticate incoming submissions from fellow editors, oversee layers, points of interest, and monitor the map's recent activity log.
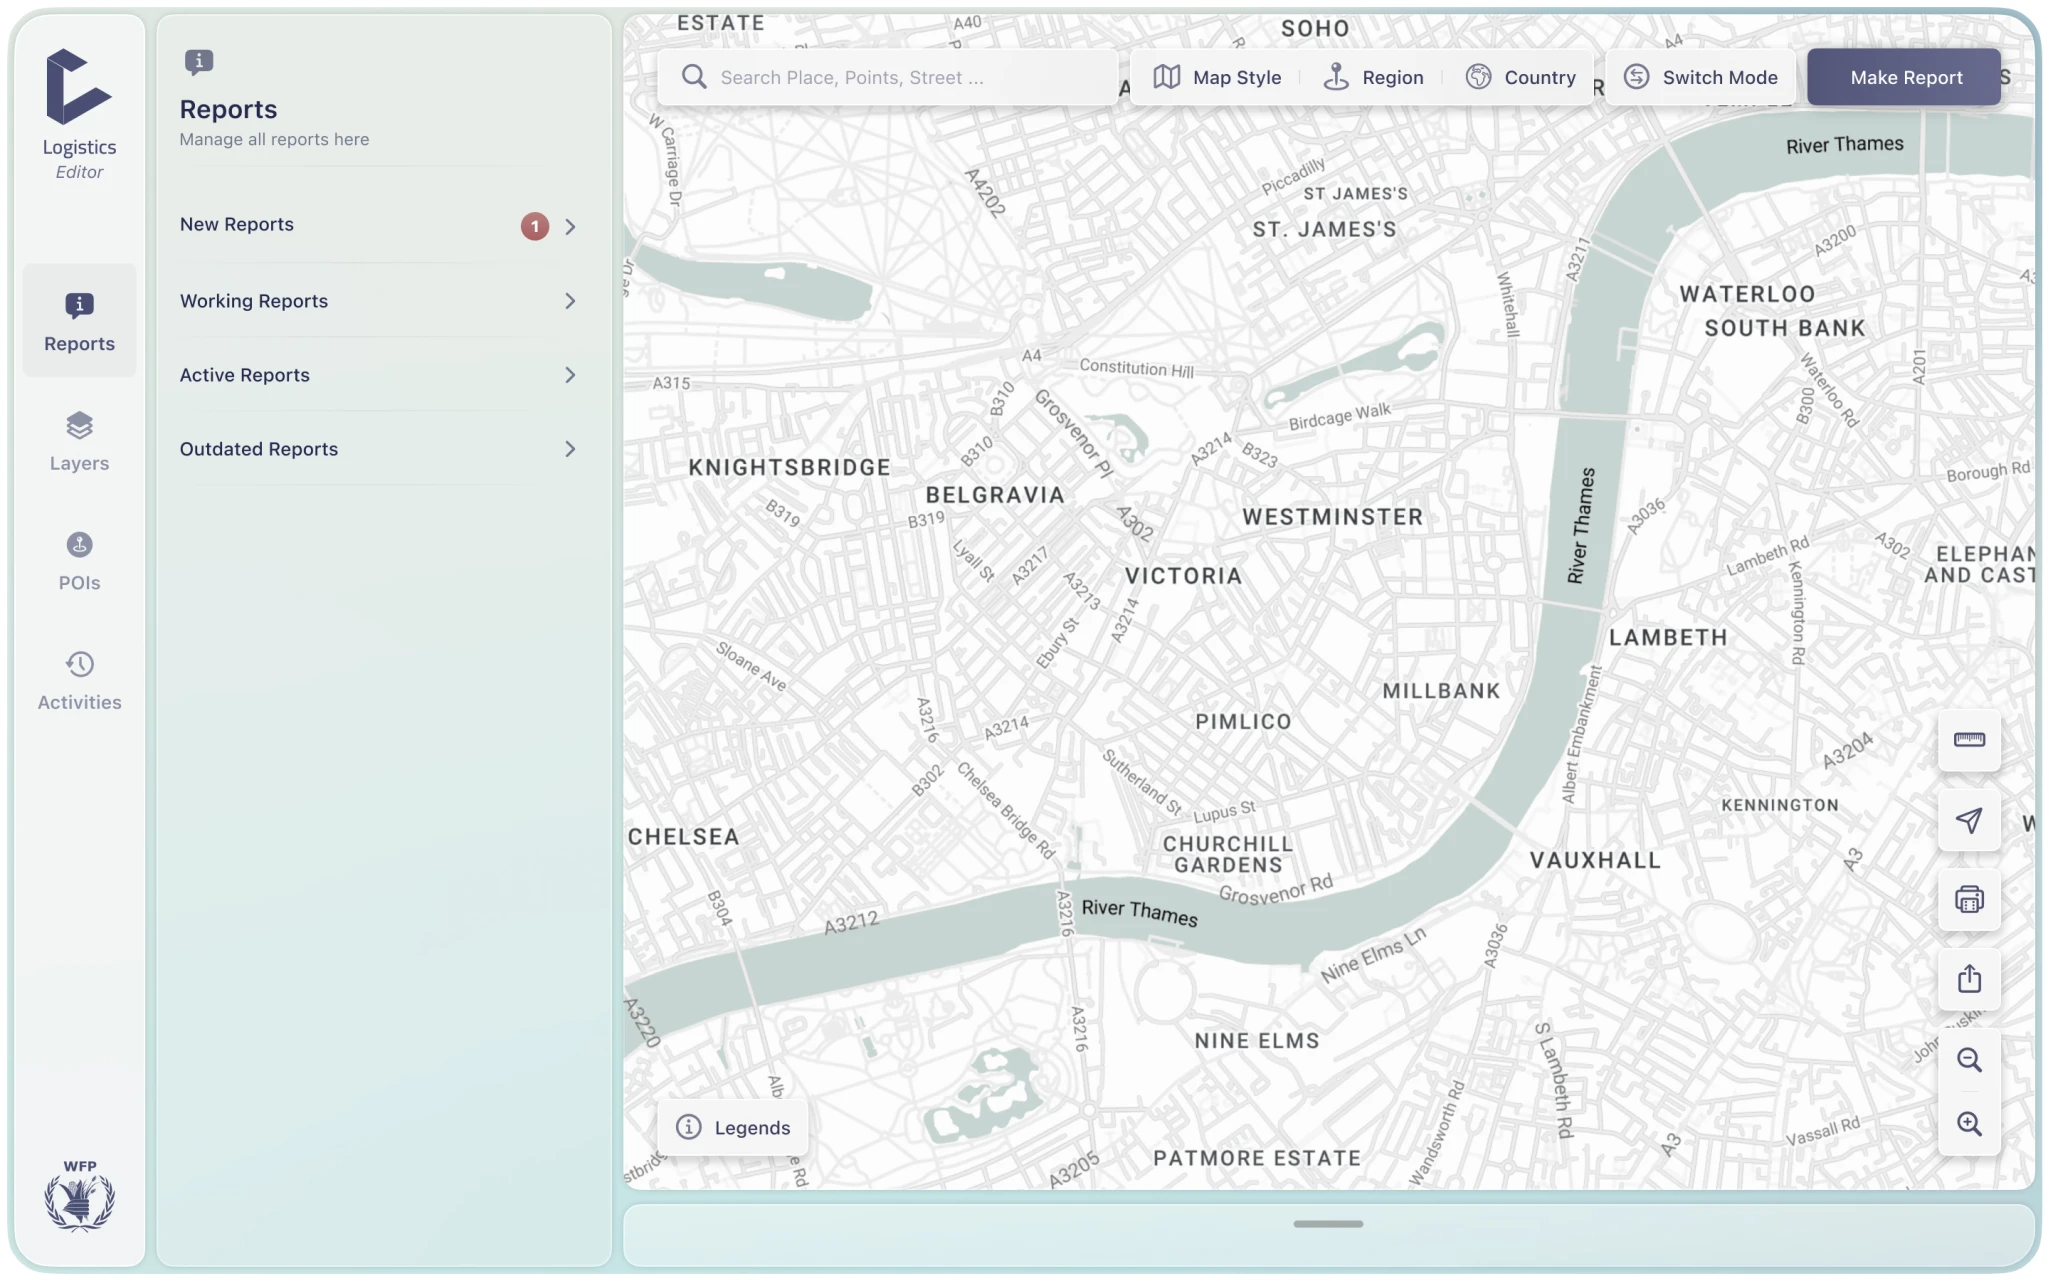
Report Management
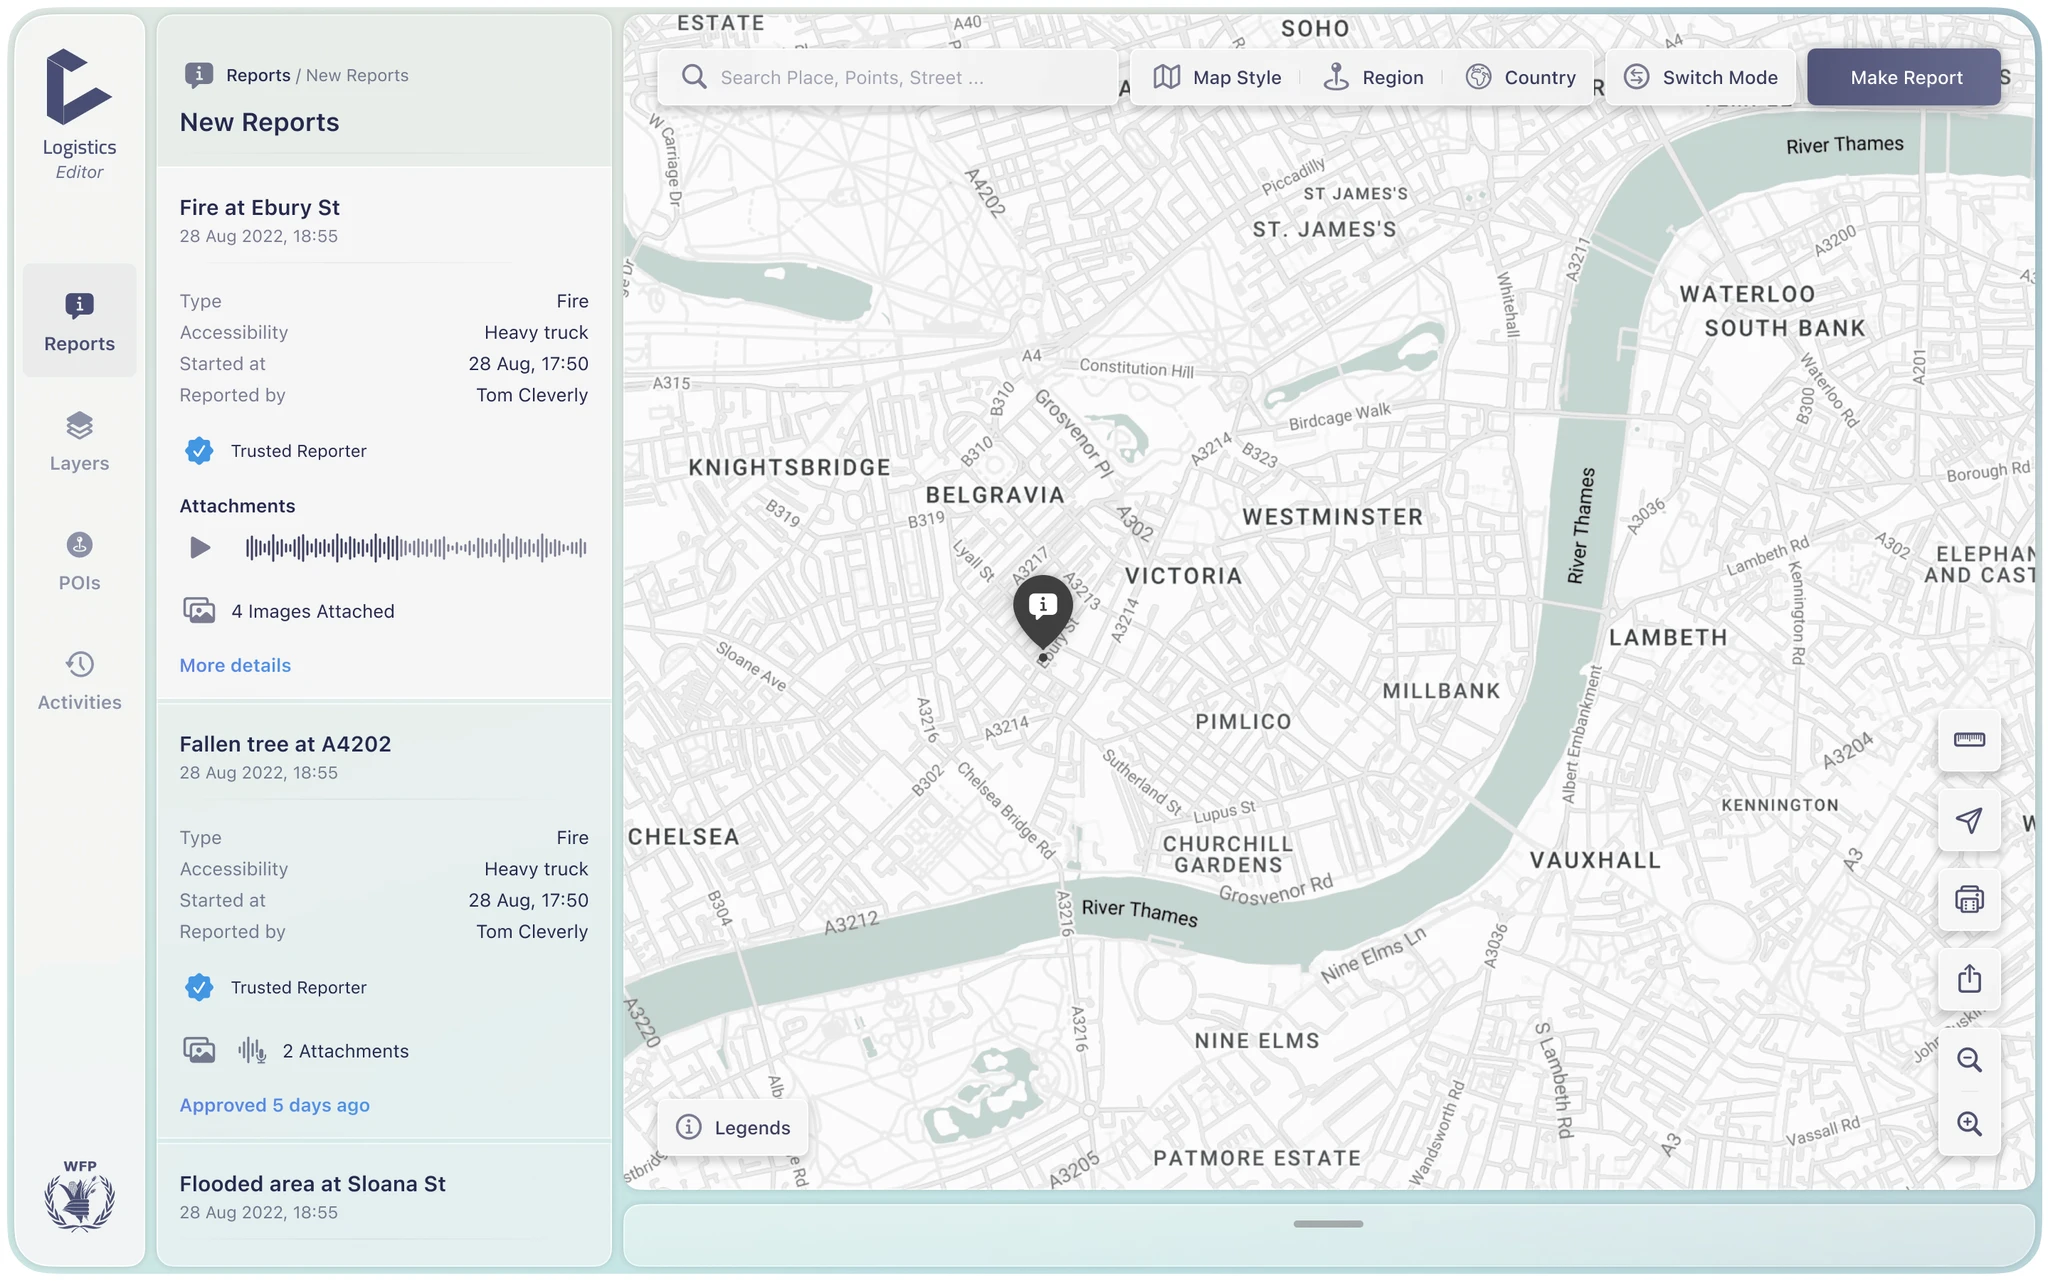
In this section, which is the most crucial part, they had access to all the reports. Whenever a new report came in, they would receive a notification to evaluate it and decide whether to include it on the map or not.
Upon opening the report, users can view details such as report type and location, followed by the name of the reporter.
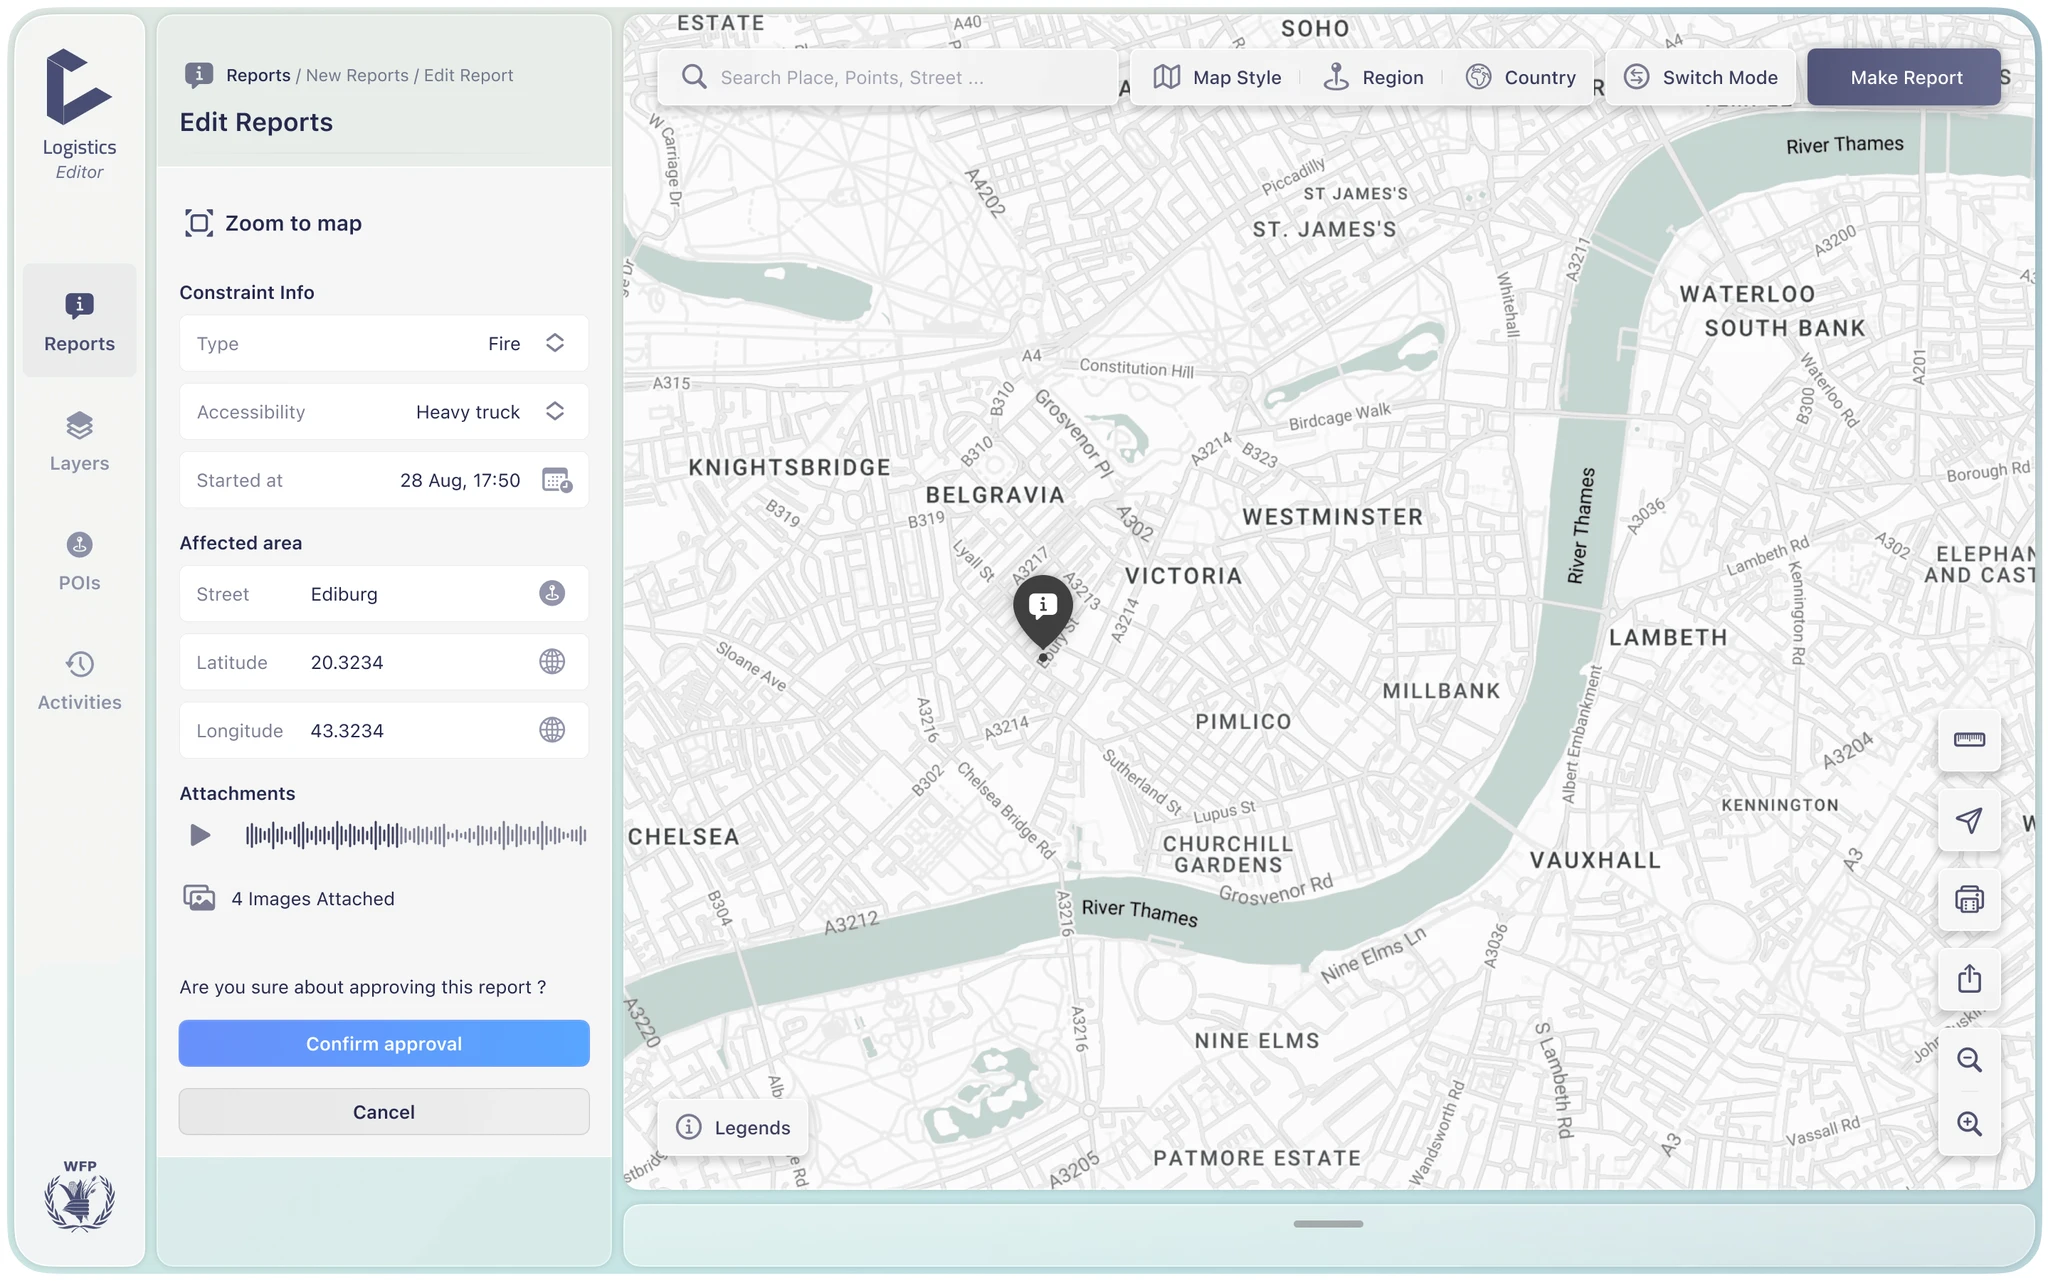
Edit & Approval
There are various scenarios that can take place when a report is submitted. The report may be approved directly or rejected. It is also possible for the report to be modified if necessary. Sometimes, a mistake may be found in the report, such as an incorrect date or location. In such cases, the report can be edited and then approved for display on the map.
What I learned
As a product designer, I encountered some situations where the business owners and I had different approaches to address a need and solve a problem. However, my unwavering commitment to providing an exceptional and user-friendly experience helped me to rise to the challenge. To tackle this, I took the lead by creating multiple alternative solutions for each problem. This approach helped us to see things from a broader perspective, which ultimately led to the best possible solution. We then tested each alternative for usability and based on the results and user feedback, we confidently selected the most effective solution.
Senior Product Designer